
An AI governance framework that is not measured is not governed — it is assumed to be working. A written AI use policy, an Approved Tools Register, and a risk tiering model are necessary foundations, but none of them tell you whether the framework is actually functioning six months after launch. Without measurement, “governance” becomes a document that was written once and never checked again — the exact failure mode the DEN Agentic AI framework calls the Static Approved Tools Register problem: controls that looked complete at launch and quietly stopped matching reality.
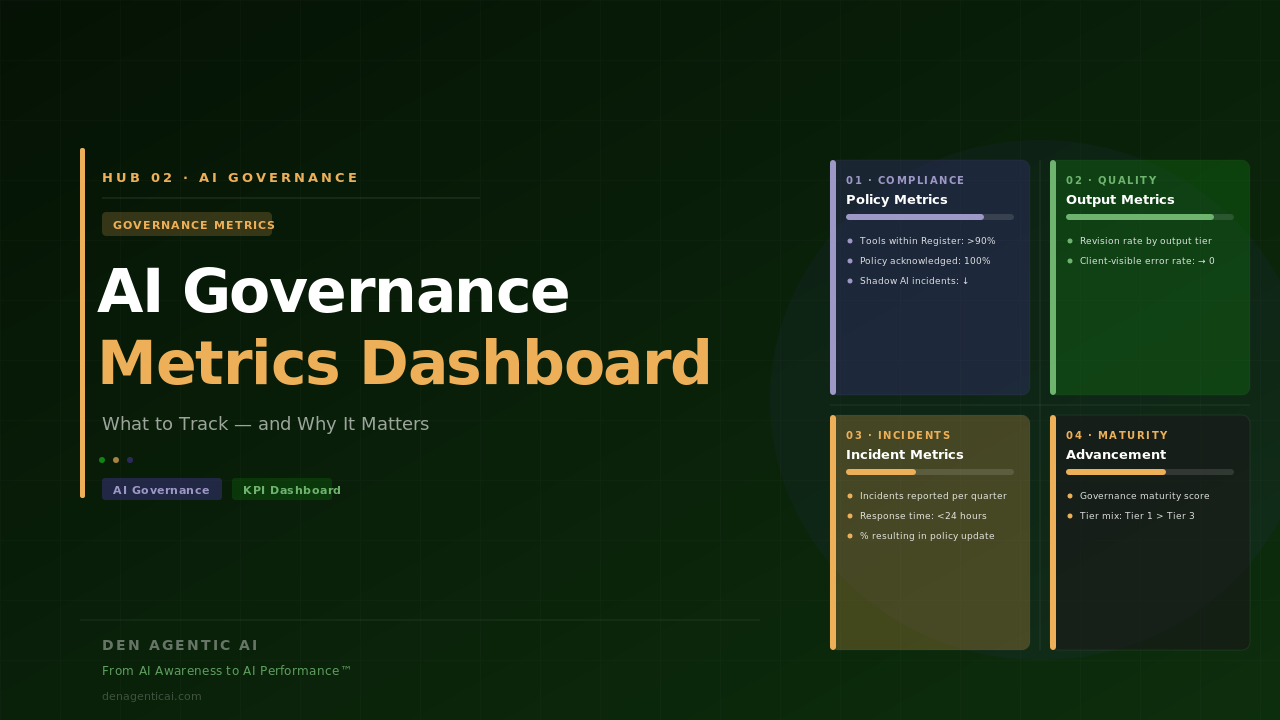
The AI Governance Metrics Dashboard closes that gap. It tracks four categories of governance health — Policy Compliance, Output Quality, Governance Incidents, and Maturity Advancement — and turns “we have a governance framework” into “our governance framework is working, and here is the evidence.”
Why Governance Requires Measurement, Not Assumption
Every element of a governance framework — the Approved Tools Register, the data classification rule, the three-tier output review policy, the incident response path — is a control. Controls degrade silently. A tool that was compliant at approval time gets a feature update that changes its data handling. An employee who signed off on the AI use policy at onboarding forgets the data classification boundaries eighteen months later. A tier classification that was accurate when an initiative launched becomes wrong the moment someone adds an autonomous “agent” feature to it.
None of these failures announce themselves. They are only visible in the data: an audit finding, a rising error rate, an incident that reveals a gap nobody had flagged. This is the same discipline that governs AI pilot measurement more broadly — an AI initiative’s Outcome, Process, and Quality KPIs only mean something if a baseline was captured before the fact. Governance metrics apply that same logic to the framework itself: you cannot know whether governance is working unless you were tracking it before something went wrong.
The AI Governance Metrics Dashboard is the mechanism the AI Governance Owner uses to check the framework’s own health on a defined cadence — not to wait for an incident to reveal that a control had already failed.
The AI Governance Metrics Dashboard: Four Categories
1. Policy Compliance Metrics
These metrics answer the question: is the governance framework actually being followed?
| Metric | How it’s measured | Target |
|---|---|---|
| % of AI tool usage within the Approved Tools Register | Periodic audit or usage reporting (SSO/API logs where available; team survey where not) | >90%, trending upward |
| % of staff who have read and acknowledged the AI use policy | Tracked on sign-off at onboarding and at each policy update | 100% within 30 days of hire or policy revision |
| Number of shadow AI incidents detected per audit | Structured audit comparing declared AI usage against the Approved Tools Register | Declining over time |
Why it matters: Policy Compliance metrics are the direct measure of shadow AI — the gap between the AI tools your organization has approved and the AI tools your employees are actually using. A declining shadow AI count is the clearest single signal that governance is closing the gap it was built to close, rather than existing only on paper.
Who owns it: The AI Governance Owner, via the quarterly Approved Tools Register review.
2. Output Quality Metrics
These metrics answer the question: is AI review actually catching problems before they reach clients?
| Metric | How it’s measured | Target |
|---|---|---|
| AI output revision rate by tier | % of AI outputs requiring significant human correction before use, tracked separately for Tier 1, 2, and 3 | Tracked and trending down; a rate near 0% on a high-volume Tier 2/3 workflow should trigger scrutiny, not celebration — it often means reviewers are rubber-stamping rather than reviewing |
| Client-visible AI error rate | How often AI errors reach clients despite Tier 2/3 review | Trending toward zero; any non-zero reading triggers the AI Incident Response Path |
Why it matters: This is the category that connects governance directly to the Responsible AI dimensions of Accuracy & Reliability and Transparency. A governance framework can look complete on paper — tiers assigned, reviewers named — while the review step itself is not actually catching errors. Output Quality metrics are the only way to verify that the review layer is doing its job, not just existing.
Who owns it: The AI Governance Owner tracks aggregate rates; Tier 2/3 reviewers are the source of the underlying revision data.
3. Governance Incident Metrics
These metrics answer the question: when something goes wrong, does the organization respond — and learn?
| Metric | How it’s measured | Target |
|---|---|---|
| Number of AI incidents reported per quarter | AI Incident Response Path submissions | Expected to rise initially as reporting culture develops, then stabilize — a near-zero count in the first two quarters usually means underreporting, not zero incidents |
| Average time from incident detection to AI Governance Owner response | Timestamp comparison between report and first response | Under 24 hours, per the minimum viable Incident Response Path |
| % of incidents resulting in an Approved Tools Register or policy update | Incident log review | High early, naturally moderating as the framework matures — evidence the framework is a living document, not the Static Approved Tools Register failure |
Why it matters: A governance framework with zero reported incidents is not necessarily a healthy one — it is frequently a framework where employees do not trust or know the reporting path. Rising incident counts in the first two quarters after launch are a positive signal of a maturing reporting culture, exactly as the hub framework anticipates. What matters is not the raw count but whether response times stay fast and whether incidents actually change something in the framework.
Who owns it: The AI Governance Owner, reviewed alongside legal/compliance for Tier 3 incidents.
4. Maturity Advancement Metrics
These metrics answer the question: is governance capability improving, or is the organization standing still?
| Metric | How it’s measured | Target |
|---|---|---|
| Governance dimension maturity score | Quarterly self-assessment using the AI Capability Maturity Model (Level 0–5) | Advancing at least one sub-level per quarter for organizations below Level 3 |
| Number of AI initiatives operating under each risk tier | Risk Tiering Register review | A governance-healthy portfolio has more Tier 1 initiatives than Tier 3 — a portfolio skewing toward Tier 3 signals either genuine business complexity or risk-tier drift that needs review |
Why it matters: The first three categories measure whether today’s controls are working. This category measures whether the organization’s overall governance capability is advancing — the difference between maintaining a static framework and building toward the AI Governance Operating Manual that Level 3+ organizations require. A rising share of Tier 3 initiatives without a corresponding rise in governance maturity is an early warning sign, not a milestone — it means the organization’s risk exposure is growing faster than its capacity to manage it.
Who owns it: The AI Governance Owner, in the quarterly governance review with executive sponsorship.
Building and Operating the Dashboard
Format: A spreadsheet is sufficient for organizations at Maturity Level 1–3 — the same principle that applies to the Approved Tools Register. Organizations at Level 4+ typically formalize the dashboard in Power BI or Looker Studio, consistent with how DEN Agentic AI configures the Adoption Metrics Dashboard under Service 3.
Cadence: Review quarterly at minimum, aligned with the same quarterly review already scheduled on Day 14 of the initial governance build. Policy Compliance and Governance Incident metrics benefit from a lighter monthly check where volume is high enough to warrant it.
Reading the dashboard — what good and at-risk look like:
- Healthy: Shadow AI incidents declining, client-visible error rate near zero, incident response time under 24 hours, governance maturity score advancing, and a Tier 1-heavy initiative portfolio.
- At risk: Rising client-visible errors despite Tier 2 review being in place, a growing share of Tier 3 initiatives with no corresponding increase in governance maturity, or incidents that keep occurring without any resulting update to the Approved Tools Register or policy — the clearest sign of a framework that exists on paper but isn’t actually operating.
The Governance Metrics Dashboard is deliverable #8 of the AI Governance Operating Manual — the primary output of Service 3 in the DEN Agentic AI advisory engagement — and is what turns “we built a governance framework” into a framework leadership can trust is still working a year later.
→ Full guide: How to build an AI governance framework →
→ Full guide: The DEN Risk Tiering Model explained →
→ Take the free Governance Assessment →
→ Return to Hub 2: The Complete Guide to AI Governance →
Frequently Asked Questions
Q: How do you measure AI governance effectiveness? AI governance effectiveness is measured across four categories: Policy Compliance (is the framework being followed?), Output Quality (is review actually catching errors?), Governance Incidents (does the organization respond to and learn from failures?), and Maturity Advancement (is governance capability improving over time?). A framework is effective when metrics in all four categories are tracked quarterly and trending in the right direction — not when the framework simply exists.
Q: What metrics should an AI governance dashboard track? At minimum: percentage of AI usage within the Approved Tools Register, policy acknowledgment rate, shadow AI incidents detected per audit, AI output revision rate by tier, client-visible AI error rate, incidents reported per quarter, average incident response time, percentage of incidents resulting in a policy update, governance maturity score, and the distribution of AI initiatives across the three risk tiers.
Q: How often should AI governance metrics be reviewed? Quarterly at minimum, aligned with the standing AI Governance Review already established in the 14-day governance build. Organizations with high AI tool volume may benefit from a lighter monthly check on Policy Compliance and Governance Incident metrics between quarterly reviews.
Q: What does a healthy AI governance metrics profile look like? Shadow AI incidents declining, client-visible AI error rate trending toward zero, incident response time consistently under 24 hours, a governance maturity score that advances at least one sub-level per quarter, and a risk tier distribution with more Tier 1 initiatives than Tier 3. A dashboard showing zero incidents and zero revisions is not automatically healthy — it often indicates underreporting or reviewers approving outputs without genuinely reviewing them.
Q: What tool should be used to build the AI Governance Metrics Dashboard? A spreadsheet is sufficient for organizations at Maturity Level 1–3, matching the same “spreadsheet first” principle used for the Approved Tools Register. Organizations at Level 4 and above typically move the dashboard into Power BI or Looker Studio, particularly once metrics need to be shared with an executive sponsor or board on a recurring cadence.
Related Posts — Hub 2: AI Governance & Responsible Adoption
- Shadow AI at Work: What It Is and How to Address It →
- How to Build an AI Governance Framework for Your Business →
- How to Write an AI Use Policy Your Team Will Actually Follow →
- The DEN Risk Tiering Model: Proportionate AI Governance Explained →
- Responsible AI: The 7 Dimensions Every Leader Must Govern →
- Return to Hub 2: The Complete Guide to AI Governance →